dsm-firmenich World Mycotoxin Survey Report

Regional contamination by commodities

With our World Mycotoxin Survey results on the current levels of mycotoxin contamination in different commodities and regions of the world, we want to inform and support feed and animal producers to get a better picture of the mycotoxin risk in their region or in imported feed ingredients.

Find results of the prevalence and contamination levels of the six well known mycotoxins in the different regions and subregions of the world. Results are displayed for the important feed ingredients corn (kernels), corn silage (on dry matter basis), soybean and wheat grains.

Download the dsm-firmenich World Mycotoxin Survey January to December 2023 [PDF]

Until December, 23,808 samples were collected and analyzed from 95 countries around the world, and the report is now available for you to download.

Asia (whole region)

Summary for Corn (Kernels) in Asia from Jan 2023 to Dec 2023
 AflaZENDONT2FUMOTA
Number of samples551743743474739474
% Contaminated samples40%41%63%20%88%28%
Average of positives (ppb)551357112037987
Median of positives (ppb)22494801718003
Maximum (ppb)13922803903761142773100

China/Taiwan

Summary for Corn (Kernels) in China/Taiwan from Jan 2023 to Dec 2023
 AflaZENDONT2FUMOTA
Number of samples380572572303568303
% Contaminated samples27%45%73%15%89%36%
Average of positives (ppb)471427601438853
Median of positives (ppb)22535291320453
Maximum (ppb)53028039037284222010

South Asia

Summary for Corn (Kernels) in South Asia from Jan 2023 to Dec 2023
 AflaZENDONT2FUMOTA
Number of samples102102102102102102
% Contaminated samples68%13%19%51%75%19%
Average of positives (ppb)438547425273017
Median of positives (ppb)30313202215303
Maximum (ppb)1716433070611742094

Southeast Asia

Summary for Corn (Kernels) in Southeast Asia from Jan 2023 to Dec 2023
 AflaZENDONT2FUMOTA
Number of samples606060606060
% Contaminated samples75%35%45%0%100%5%
Average of positives (ppb)95101156 485066
Median of positives (ppb)183285 120396
Maximum (ppb)139212751107 142773100

Americas (whole region)

Summary for Corn (Kernels) in Americas (whole region) from Jan 2023 to Dec 2023
 AflaZENDONT2FUMOTA
Number of samples340232782325220728581620
% Contaminated samples17%36%42%10%66%0%
Average of positives (ppb)301128954124665
Median of positives (ppb)2464853412293
Maximum (ppb)98464310113002548317519

North America

Summary for Corn (Kernels) in North America from Jan 2023 to Dec 2023
 AflaZENDONT2FUMOTA
Number of samples479481481477481475
% Contaminated samples9%51%68%6%76%0%
Average of positives (ppb)4021813712342053
Median of positives (ppb)9665551113833
Maximum (ppb)327431011300100831753

Central America

Summary for Corn (Kernels) in Central America from Jan 2023 to Dec 2023
 AflaZENDONT2FUMOTA
Number of samples275274274274274274
% Contaminated samples17%45%70%3%95%1%
Average of positives (ppb)841116712725532
Median of positives (ppb)355515917802
Maximum (ppb)984625574802103160193

South America

Summary for Corn (Kernels) in South America from Jan 2023 to Dec 2023
 AflaZENDONT2FUMOTA
Number of samples26482523157014562103871
% Contaminated samples19%33%29%13%60%0%
Average of positives (ppb)10816464419459
Median of positives (ppb)2434223610703
Maximum (ppb)1766261252002542473019

Middle East & North Africa

Summary for Corn (Kernels) in Middle East & North Africa from Jan 2023 to Dec 2023
 AflaZENDONT2FUMOTA
Number of samples382121215821
% Contaminated samples18%24%71%14%95%5%
Average of positives (ppb)448454642250710
Median of positives (ppb)24818723103510
Maximum (ppb)1421933177864877810

Africa (whole region)

Summary for Corn (Kernels) in Africa (whole region) from Jan 2023 to Dec 2023
 AflaZENDONT2FUMOTA
Number of samples363322322322362322
% Contaminated samples10%48%90%1%63%1%
Average of positives (ppb)2107068319920498
Median of positives (ppb)30143352025712
Maximum (ppb)289921561461127127721963

Sub-Saharan Africa (excl. South Africa)

Summary for Corn (Kernels) in Subsaharan-Africa (excl. South Africa) from Jan 2023 to Dec 2023
 AflaZENDONT2FUMOTA
Number of samples12685858512585
% Contaminated samples27%60%87%0%79%5%
Average of positives (ppb)222110658 1702498
Median of positives (ppb)3319175 115912
Maximum (ppb)289921565442 127721963

South Africa

Summary for Corn (Kernels) in South Africa from Jan 2023 to Dec 2023
 AflaZENDONT2FUMOTA
Number of samples237237237237237237
% Contaminated samples1%44%91%1%55%0%
Average of positives (ppb)15069219325 
Median of positives (ppb)1133682088 
Maximum (ppb)193714611273471 

Europe (whole region)

Summary for Corn (Kernels) in Europe from Jan 2023 to Dec 2023
 AflaZENDONT2FUMOTA
Number of samples92610731093679882649
% Contaminated samples22%66%77%47%77%7%
Average of positives (ppb)1711288275126637
Median of positives (ppb)434478263448
Maximum (ppb)1362393720440253437540386

Central Europe

Summary for Corn (Kernels) in Central Europe from Jan 2023 to Dec 2023
 AflaZENDONT2FUMOTA
Number of samples300439453177311149
% Contaminated samples10%72%89%43%75%11%
Average of positives (ppb)6012610415554642
Median of positives (ppb)653627261628
Maximum (ppb)136230792044034310715294

Northern Europe

Summary for Corn (Kernels) in Northern Europe from Jan 2023 to Dec 2023
 AflaZENDONT2FUMOTA
Number of samples384545434038
% Contaminated samples3%67%73%33%35%0%
Average of positives (ppb)1156101542549 
Median of positives (ppb)15573925134 
Maximum (ppb)1107765241623646 

Eastern Europe

Summary for Corn (Kernels) in Eastern Europe from Jan 2023 to Dec 2023
 AflaZENDONT2FUMOTA
Number of samples265269269258269258
% Contaminated samples2%64%69%62%74%5%
Average of positives (ppb)311379659173552
Median of positives (ppb)430536322367
Maximum (ppb)11239371030325349080386

Southern Europe

Summary for Corn (Kernels) in Southern Europe from Jan 2023 to Dec 2023
 AflaZENDONT2FUMOTA
Number of samples323320326201262204
% Contaminated samples50%59%67%33%90%8%
Average of positives (ppb)95750067247621
Median of positives (ppb)41824118102316
Maximum (ppb)12458284317233754096

Asia (whole region)

Summary for Corn Silage in Asia (whole region) from Jan 2023 to Dec 2023
 AflaZENDONT2FUMOTA
Number of samples959595959595
% Contaminated samples9%43%39%15%86%6%
Average of positives (ppb)183131313699244
Median of positives (ppb)1394372521953
Maximum (ppb)55253712059274261438

China/Taiwan

Summary for Corn Silage in China/Taiwan from Jan 2023 to Dec 2023
 AflaZENDONT2FUMOTA
Number of samples111111111111
% Contaminated samples0%64%91%0%100%0%
Average of positives (ppb) 6951143 761 
Median of positives (ppb) 98455 315 
Maximum (ppb) 25374206 2885 

East Asia

Summary for Corn Silage in East Asia from Jan 2023 to Dec 2023
 AflaZENDONT2FUMOTA
Number of samples202020202020
% Contaminated samples5%45%70%30%65%0%
Average of positives (ppb)196112171144 
Median of positives (ppb)142411876 
Maximum (ppb)1298575238714 

South Asia

Summary for Corn Silage in South Asia from Jan 2023 to Dec 2023
 AflaZENDONT2FUMOTA
Number of samples333333333333
% Contaminated samples21%9%3%9%88%18%
Average of positives (ppb)2221223151894
Median of positives (ppb)172322314903
Maximum (ppb)55312231918458

Oceania

Summary for Corn Silage in Oceania from Jan 2023 to Dec 2023
 AflaZENDONT2FUMOTA
Number of samples292929292929
% Contaminated samples3%69%38%17%93%0%
Average of positives (ppb)28296938132 
Median of positives (ppb)2305601766 
Maximum (ppb)2348402091761 

Americas (whole region)

Summary for Corn Silage in Americas (whole region) from Jan 2023 to Dec 2023
 AflaZENDONT2FUMOTA
Number of samples435437380357381348
% Contaminated samples9%63%76%1%23%3%
Average of positives (ppb)1644420282848968
Median of positives (ppb)1320112382844315
Maximum (ppb)7810440277003541191834

North America

Summary for Corn Silage in North America from Jan 2023 to Dec 2023
 AflaZENDONT2FUMOTA
Number of samples285285285285285285
% Contaminated samples3%60%89%0%19%3%
Average of positives (ppb)24562123 9108
Median of positives (ppb)22041260 3925
Maximum (ppb)51044027700 1191834

Central America

Summary for Corn Silage in Central America from Jan 2023 to Dec 2023
 AflaZENDONT2FUMOTA
Number of samples191919191919
% Contaminated samples11%63%47%0%32%0%
Average of positives (ppb)21291341 817 
Median of positives (ppb)2361134 573 
Maximum (ppb)25303946 1480 

South America

Summary for Corn Silage in South America from Jan 2023 to Dec 2023
 AflaZENDONT2FUMOTA
Number of samples13113376537744
% Contaminated samples23%70%33%2%35%0%
Average of positives (ppb)224621324354887 
Median of positives (ppb)21207722354494 
Maximum (ppb)78251760003549420 

Africa (whole region)

Summary for Corn Silage in Africa (whole region) from Jan 2023 to Dec 2023
 AflaZENDONT2FUMOTA
Number of samples404040404040
% Contaminated samples0%73%83%0%30%0%
Average of positives (ppb) 1961698 172 
Median of positives (ppb) 56786 104 
Maximum (ppb) 19057679 753 

South Africa

Summary for Corn Silage in South Africa from Jan 2023 to Dec 2023
 AflaZENDONT2FUMOTA
Number of samples373737373737
% Contaminated samples0%73%84%0%30%0%
Average of positives (ppb) 1941776 119 
Median of positives (ppb) 56791 91 
Maximum (ppb) 19057679 261 

Europe (whole region)

Summary for Corn Silage in Europe (whole region) from Jan 2023 to Dec 2023
 AflaZENDONT2FUMOTA
Number of samples79211911195766779767
% Contaminated samples4%70%79%6%46%2%
Average of positives (ppb)9200968675985
Median of positives (ppb)563568261183
Maximum (ppb)5713187252759551596214

Central Europe

Summary for Corn Silage in Central Europe from Jan 2023 to Dec 2023
 AflaZENDONT2FUMOTA
Number of samples440845850431439431
% Contaminated samples2%72%88%4%51%1%
Average of positives (ppb)7184966511993
Median of positives (ppb)37657920673
Maximum (ppb)2842661037547634064

Northern Europe

Summary for Corn Silage in Northern Europe from Jan 2023 to Dec 2023
 AflaZENDONT2FUMOTA
Number of samples154155155155154154
% Contaminated samples1%80%79%1%7%0%
Average of positives (ppb)125010812917 
Median of positives (ppb)1356272914 
Maximum (ppb)1557478903235 

Eastern Europe

Summary for Corn Silage in Eastern Europe from Jan 2023 to Dec 2023
 AflaZENDONT2FUMOTA
Number of samples838383838383
% Contaminated samples1%54%46%18%47%5%
Average of positives (ppb)13575241106278
Median of positives (ppb)1331450283438
Maximum (ppb)133811488955333610

Southern Europe

Summary for Corn Silage in Southern Europe from Jan 2023 to Dec 2023
 AflaZENDONT2FUMOTA
Number of samples1151081079710399
% Contaminated samples19%52%40%7%86%5%
Average of positives (ppb)1038910642816564
Median of positives (ppb)726274274532
Maximum (ppb)571318725275491596214

Asia (whole region)

Summary for Soybean in Asia (whole region) from Jan 2023 to Dec 2023
 AflaZENDONT2FUMOTA
Number of samples109108109979797
% Contaminated samples29%67%16%51%40%56%
Average of positives (ppb)639233306524
Median of positives (ppb)33559303915
Maximum (ppb)492458305540087

China/Taiwan

Summary for Soybean in China/Taiwan from Jan 2023 to Dec 2023
 AflaZENDONT2FUMOTA
Number of samples232223111111
% Contaminated samples35%64%17%9%91%9%
Average of positives (ppb)239210115010
Median of positives (ppb)244218113710
Maximum (ppb)451344119010

South Asia

Summary for Soybean in South Asia from Jan 2023 to Dec 2023
 AflaZENDONT2FUMOTA
Number of samples535353535353
% Contaminated samples30%92%11%91%8%96%
Average of positives (ppb)10454863025525
Median of positives (ppb)5376303030015
Maximum (ppb)492458305540087

Southeast Asia

Summary for Soybean in Southeast Asia from Jan 2023 to Dec 2023
 AflaZENDONT2FUMOTA
Number of samples242424242424
% Contaminated samples29%25%21%0%75%4%
Average of positives (ppb)31031 382
Median of positives (ppb)11028 332
Maximum (ppb)141650 1172

Americas (whole region)

Summary for Soybean in Americas (whole region) from Jan 2023 to Dec 2023
 AflaZENDONT2FUMOTA
Number of samples1868191510091444996995
% Contaminated samples37%58%9%27%12%2%
Average of positives (ppb)367350429433
Median of positives (ppb)243260335233
Maximum (ppb)26565274017846725

North America

Summary for Soybean in North America from Jan 2023 to Dec 2023
 AflaZENDONT2FUMOTA
Number of samples404040404040
% Contaminated samples8%40%15%5%33%13%
Average of positives (ppb)1173828603
Median of positives (ppb)115688283
Maximum (ppb)1381790112055

Central America

Summary for Soybean in Central America from Jan 2023 to Dec 2023
 AflaZENDONT2FUMOTA
Number of samples168168168168168168
% Contaminated samples5%20%8%0%6%7%
Average of positives (ppb)19214 15582
Median of positives (ppb)12173 12802
Maximum (ppb)185655 46724

South America

Summary for Soybean in South America from Jan 2023 to Dec 2023
 AflaZENDONT2FUMOTA
Number of samples166017078011236788787
% Contaminated samples41%62%9%31%12%1%
Average of positives (ppb)3703754210014
Median of positives (ppb)244290336453
Maximum (ppb)26565274017837604

Africa (whole region)

Summary for Soybean in Africa (whole region) from Jan 2023 to Dec 2023
 AflaZENDONT2FUMOTA
Number of samples969696969696
% Contaminated samples20%7%10%0%4%3%
Average of positives (ppb)220312 4214
Median of positives (ppb)1694 315
Maximum (ppb)6832030 16135

Sub-Saharan Africa (excl. South Africa)

Summary for Soybean in Sub-Saharan Africa (excl. South Africa) from Jan 2023 to Dec 2023
 AflaZENDONT2FUMOTA
Number of samples505050505050
% Contaminated samples36%12%14%0%6%6%
Average of positives (ppb)2991 5454
Median of positives (ppb)2590 125
Maximum (ppb)624126 16135

South Africa

Summary for Soybean in South Africa from Jan 2023 to Dec 2023
 AflaZENDONT2FUMOTA
Number of samples464646464646
% Contaminated samples2%2%7%0%2%0%
Average of positives (ppb)183829 50 
Median of positives (ppb)183432 50 
Maximum (ppb)1832030 50 

Europe (whole region)

Summary for Soybean in Europe (whole region) from Jan 2023 to Dec 2023
 AflaZENDONT2FUMOTA
Number of samples185206207185185184
% Contaminated samples6%54%17%26%11%5%
Average of positives (ppb)82811937364
Median of positives (ppb)396710212
Maximum (ppb)6828137065911912

Central Europe

Summary for Soybean in Central Europe from Jan 2023 to Dec 2023
 AflaZENDONT2FUMOTA
Number of samples768888777877
% Contaminated samples5%64%25%22%10%5%
Average of positives (ppb)23812636513
Median of positives (ppb)1196116263
Maximum (ppb)32813292981195

Northern Europe

Summary for Soybean in Northern Europe from Jan 2023 to Dec 2023
 AflaZENDONT2FUMOTA
Number of samples101111111010
% Contaminated samples0%27%9%9%10%0%
Average of positives (ppb) 4315213 
Median of positives (ppb) 4315213 
Maximum (ppb) 5315213 

Eastern Europe

Summary for Soybean in Eastern Europe from Jan 2023 to Dec 2023
 AflaZENDONT2FUMOTA
Number of samples697474706969
% Contaminated samples1%57%11%41%0%7%
Average of positives (ppb)685240 4
Median of positives (ppb)63468 2
Maximum (ppb)647106659 12

Southern Europe

Summary for Soybean in Southern Europe from Jan 2023 to Dec 2023
 AflaZENDONT2FUMOTA
Number of samples303334272828
% Contaminated samples23%30%15%4%39%0%
Average of positives (ppb)1361155727 
Median of positives (ppb)412114718 
Maximum (ppb)68199370774 

Asia (whole region)

Summary for Wheat Grains in Asia (whole region) from Jan 2023 to Dec 2023
 AflaZENDONT2FUMOTA
Number of samples114242245110111110
% Contaminated samples2%62%65%9%59%8%
Average of positives (ppb)24890914633
Median of positives (ppb)24342112342
Maximum (ppb)327610556224909

China/Taiwan

Summary for Wheat Grains in China/Taiwan from Jan 2023 to Dec 2023
 AflaZENDONT2FUMOTA
Number of samples50178181464746
% Contaminated samples2%76%63%15%53%20%
Average of positives (ppb)351910131103
Median of positives (ppb)34648112382
Maximum (ppb)32768301204909

Oceania

Summary for Wheat Grains in Oceania from Jan 2023 to Dec 2023
 AflaZENDONT2FUMOTA
Number of samples575757575757
% Contaminated samples2%25%70%5%60%0%
Average of positives (ppb)11810071435 
Median of positives (ppb)1101971134 
Maximum (ppb)1761055622134 

Americas (whole region)

Summary for Wheat Grains in Americas (whole region) from Jan 2023 to Dec 2023
 AflaZENDONT2FUMOTA
Number of samples938656826066
% Contaminated samples28%43%29%28%20%5%
Average of positives (ppb)2105115947647222
Median of positives (ppb)2313055031512
Maximum (ppb)7208013210734575649

North America

Summary for Wheat Grains in North America from Jan 2023 to Dec 2023
 AflaZENDONT2FUMOTA
Number of samples222222222222
% Contaminated samples0%9%23%0%5%5%
Average of positives (ppb) 10422821 457512
Median of positives (ppb) 1042213 457512
Maximum (ppb) 208013210 457512

South America

Summary for Wheat Grains in South America from Jan 2023 to Dec 2023
 AflaZENDONT2FUMOTA
Number of samples645727533137
% Contaminated samples39%56%33%43%35%5%
Average of positives (ppb)25444247289326
Median of positives (ppb)24038650290326
Maximum (ppb)7135110273820649

Africa (whole region)

Summary for Wheat Grains in Africa (whole region) from Jan 2023 to Dec 2023
 AflaZENDONT2FUMOTA
Number of samples101010101010
% Contaminated samples0%60%100%0%30%0%
Average of positives (ppb) 32861 126 
Median of positives (ppb) 29483 135 
Maximum (ppb) 652898 213 

Europe (whole region)

Summary for Wheat Grains in Europe (whole region) from Jan 2023 to Dec 2023
 AflaZENDONT2FUMOTA
Number of samples63713381369872636615
% Contaminated samples5%24%41%19%9%4%
Average of positives (ppb)5502971819921
Median of positives (ppb)4127712426
Maximum (ppb)23547484591501272162

Central Europe

Summary for Wheat Grains in Central Europe from Jan 2023 to Dec 2023
 AflaZENDONT2FUMOTA
Number of samples229767794331229224
% Contaminated samples0%18%34%18%10%1%
Average of positives (ppb)241339194073
Median of positives (ppb)21478153233
Maximum (ppb)291184596512725

Northern Europe

Summary for Wheat Grains in Northern Europe from Jan 2023 to Dec 2023
 AflaZENDONT2FUMOTA
Number of samples100224224224100100
% Contaminated samples0%39%60%15%2%7%
Average of positives (ppb) 94279172636
Median of positives (ppb) 1775152616
Maximum (ppb) 547443023848162

Eastern Europe

Summary for Wheat Grains in Eastern Europe from Jan 2023 to Dec 2023
 AflaZENDONT2FUMOTA
Number of samples234250250235234234
% Contaminated samples0%14%41%20%3%4%
Average of positives (ppb) 17112171421
Median of positives (ppb) 5399115
Maximum (ppb) 30790315035120

Southern Europe

Summary for Wheat Grains in Southern Europe from Jan 2023 to Dec 2023
 AflaZENDONT2FUMOTA
Number of samples7497101827367
% Contaminated samples46%58%52%29%30%4%
Average of positives (ppb)52248819553
Median of positives (ppb)41033213173
Maximum (ppb)232892785705603

Mycotoxin Solutions

  • Mycofix®

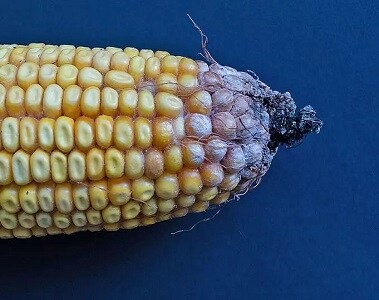
    The Mycofix® portfolio of feed additives represents the most state-of-the-art solution for protecting animal health by deactivating mycotoxins that contaminate farm animal feed. Its safety and efficacy are proven by 7 EU authorizations for substances that deactivate mycotoxins.

  • Mycofix® Plus 5.Z

    Absolute protection against the broadest range of mycotoxins. With ZENzyme® Faster and Better

  • Mycotoxin Contamination

    Our portfolio of tools helps to understand the potential risks of mycotoxins for animal species and location.

  • Mycotoxin Analysis

    We offer a range of analytical services to customers to assess the mycotoxin contamination of feed materials.

  • Mycotoxin Prediction

    The Mycotoxin Prediction Service delivers assessments of expected mycotoxin levels in the upcoming harvest of corn (maize) and wheat around the world.

  • dsm-firmenich Mycotoxin Survey

    The dsm-firmenich Mycotoxin Survey constitutes the longest running and most comprehensive data set on mycotoxin occurrence. The survey results provide insights on the incidence of the six major mycotoxins in the agricultural commodities used for livestock feed in order to identify the potential risk posed to livestock animal production.

Share